What does it actually cost to serve one customer?
Turn infrastructure spend into a number your finance team can use — cost per customer, per transaction, per team, tracked over time.
Define your services
Map the infrastructure that makes up a service — the servers, tools, and cloud costs behind it.
Define your metrics
Pick what "a unit" means to you — customers, API calls, transactions — and link it to the services behind it.
Track cost per unit
Watch the number move over time, with sparkline trends so a spike doesn't sit unnoticed for a quarter.
Catch efficiency loss early
Get a clear signal when cost per unit starts climbing, before it shows up as a margin problem.
Define your services
Map the infrastructure that makes up a service — the servers, tools, and cloud costs behind it.
Define your metrics
Pick what "a unit" means to you — customers, API calls, transactions — and link it to the services behind it.
Track cost per unit
Watch the number move over time, with sparkline trends so a spike doesn't sit unnoticed for a quarter.
Catch efficiency loss early
Get a clear signal when cost per unit starts climbing, before it shows up as a margin problem.
INTEGRATIONS
Every source of spend, one connection away


See it from three seats
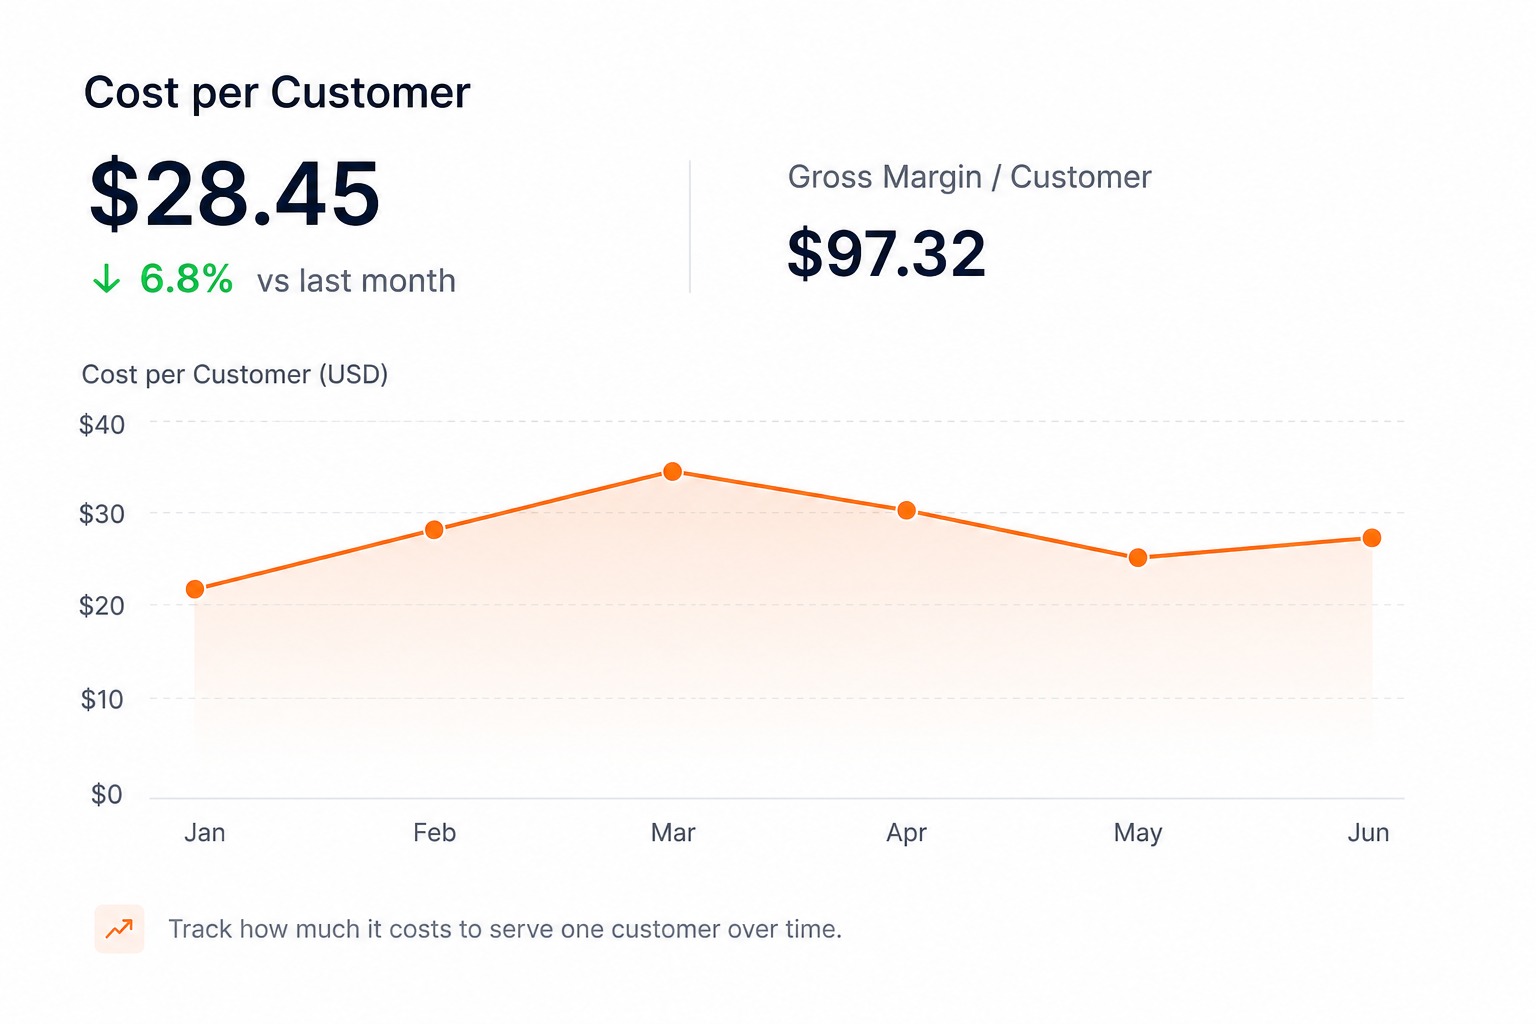
For the CFO: “What's our cost per customer?”
Map your infrastructure spend to your customer base and watch gross margin per customer move month over month — the number investors ask for, without exporting billing data into a spreadsheet by hand.
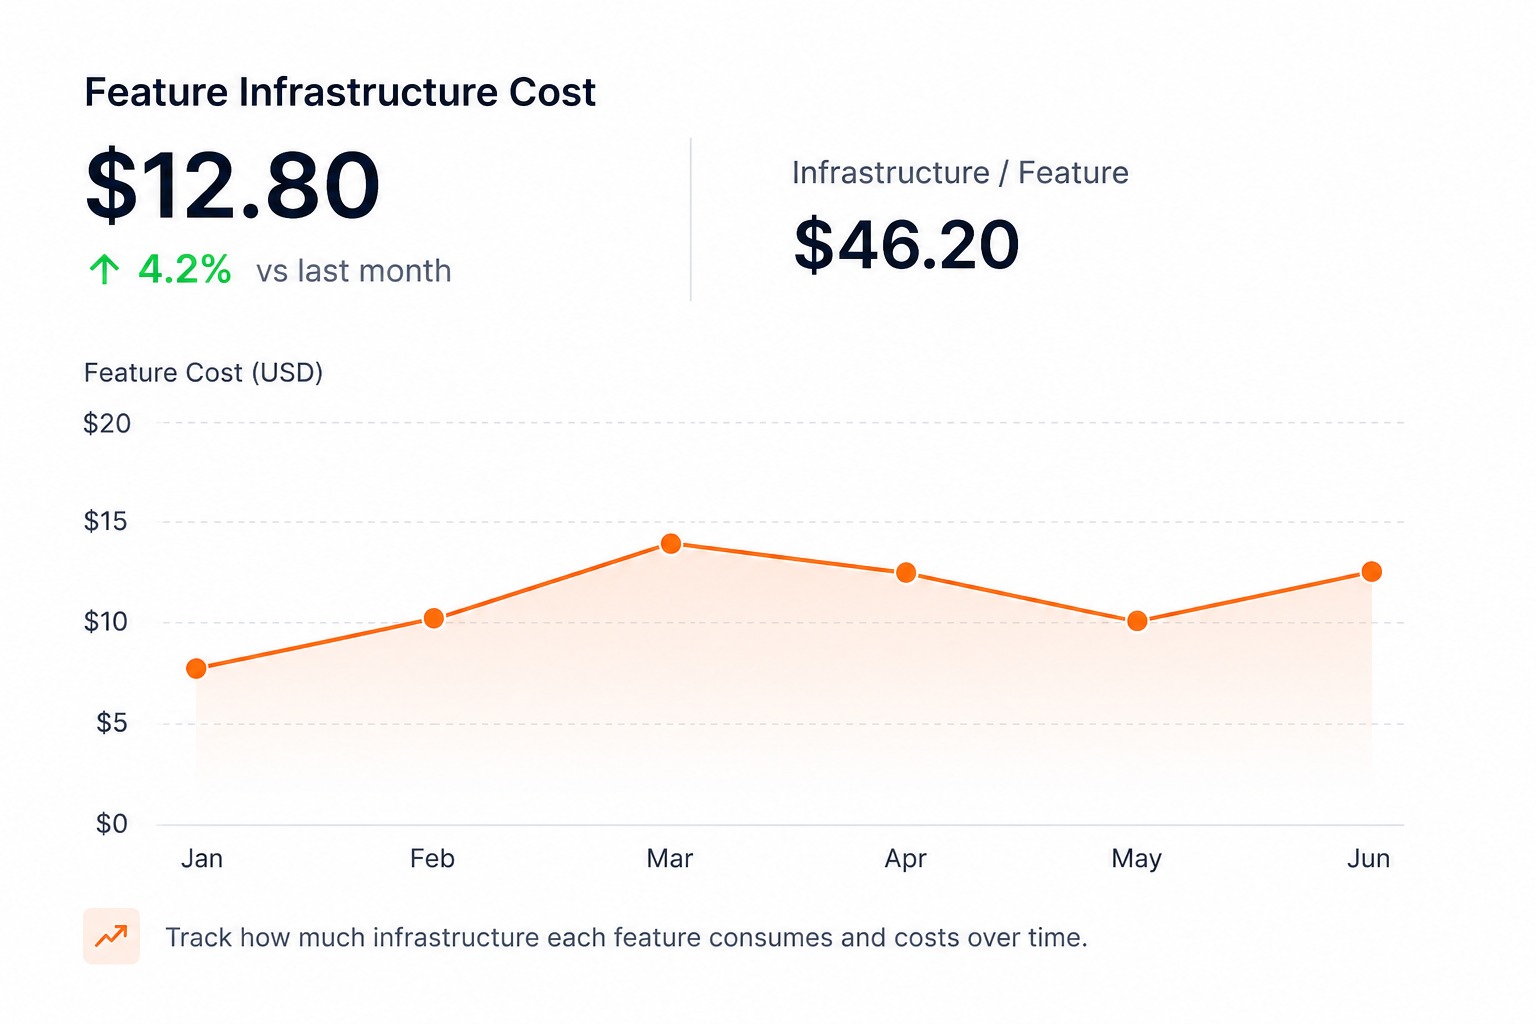
For the CTO: “What does this feature actually cost us?”
Tie a service's infra footprint to a specific feature and see whether the engineering investment is paying for itself, or quietly becoming the most expensive part of the product. (Coming soon)
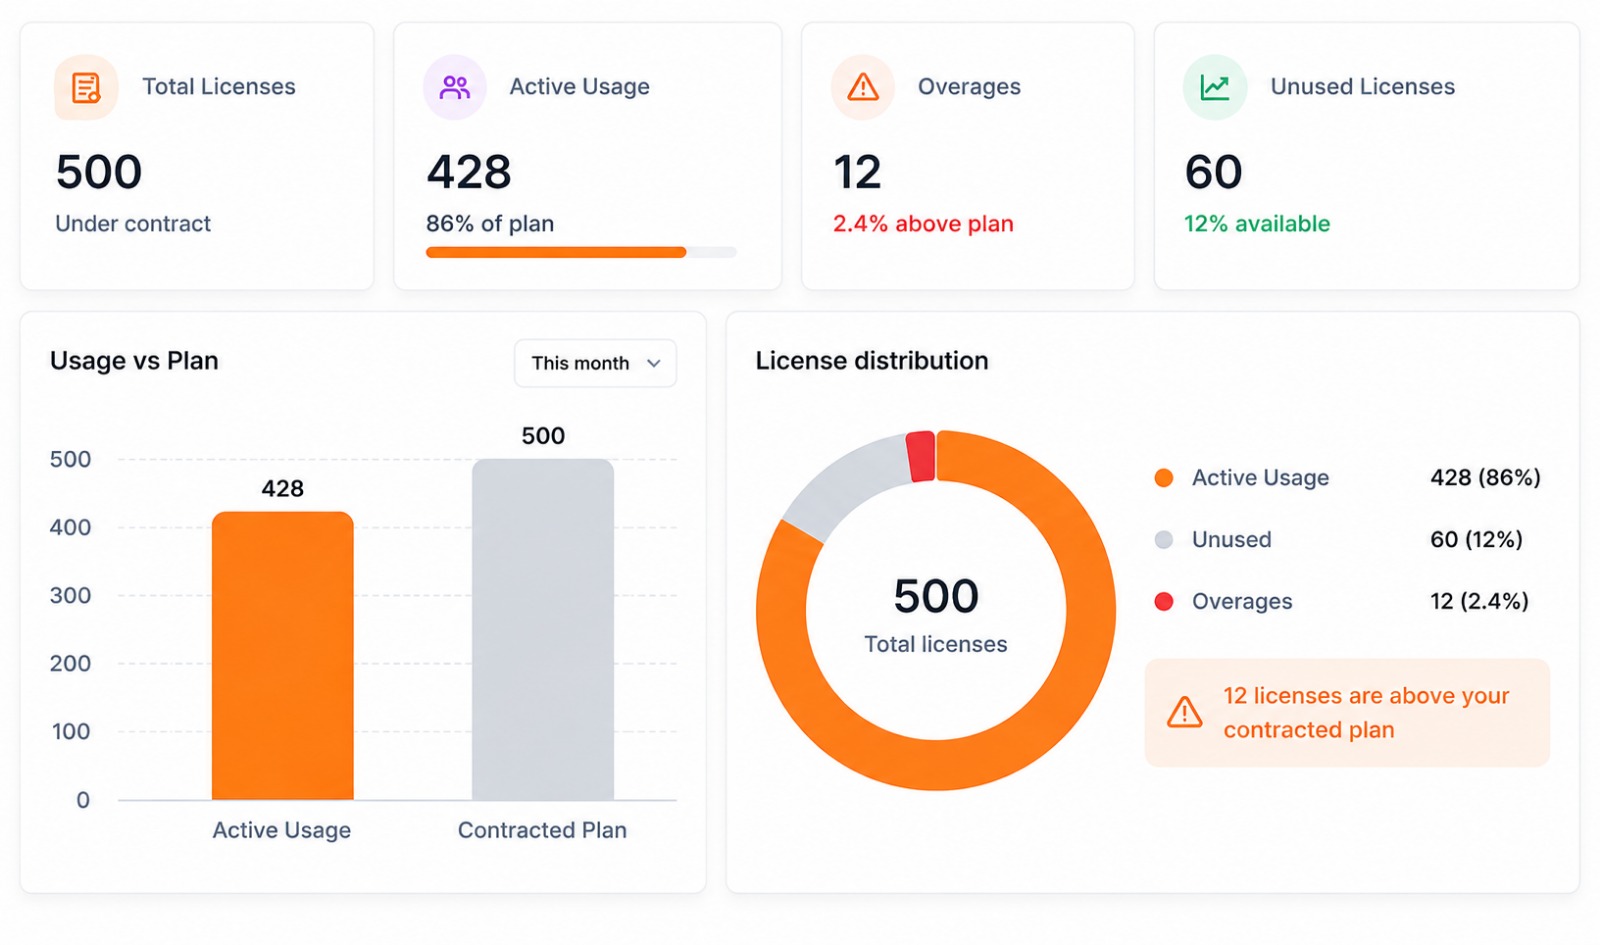
For the DevOps lead: “Is this workload getting more expensive to run?”
Track cost per transaction or per API call as usage scales, and catch the moment infrastructure efficiency starts sliding backward — before it turns into a rewrite nobody planned for.
What's Coming Next
- 01
Customer-level cost, automatically.
Right now, defining "a customer" as your metric is manual. A native CRM connection (Salesforce, HubSpot) will pull customer counts in directly.
- 02
Feature-level cost, automatically.
Same idea, but for engineering — an APM integration will connect service costs to specific features without manual mapping.
- 03
An agent that explains the "why."
Instead of just showing that margin dropped, the plan is for the FinOps agent to explain what drove it — and suggest what to change.
- 04
Forecasted unit cost.
Not just where cost-per-unit is today, but where it's headed if current growth continues.
- 05
Reports built for outside the building.
Board-ready and investor-ready exports, not just internal dashboards.
Built for every stakeholder
- See which services are driving cost, not just which cloud bill is largest
- A foundation for conversations with finance that don't start from a spreadsheet
- Early warning when a service's cost footprint is growing faster than its usage
Frequently Asked Questions
Everything you need to know about Digitomics and how we help organizations optimize their technology ROI.
Know what one customer actually costs you
Stop rebuilding this in a spreadsheet every month.