One Platform. Every Tech Dollar. Dashboards Built for Your Role.
Stop jumping between fragmented consoles. Digitomics pulls your cloud infrastructure, AI spend, and vendor contracts into one dashboard, built around whoever's looking at it.
Spend Overview
Live · updated 2m ago
Total Spend
$0K
8.2%Idle Waste
$96K
12.4%Unit Cost
$0.014
5.2%Forecast
$2.1M
3.6%Multi-cloud spend
AWS · Azure · GCP
Cost breakdown
- Compute42%
- Storage22%
- Data18%
- Network18%
Budget utilization
AI savings
$15.6K/moRightsize 12 EC2 instances
Compute
Delete 84 orphaned EBS volumes
Storage
Convert to Savings Plans (3yr)
Commit
Anomalies
2 activeLambda invocations
High severity
NAT Gateway egress
Med severity
INTEGRATIONS
Works with every source you already connect.


Built for enterprise governance and zero data leakage.
Tenant Isolation Validated
Every tenant's data is logically isolated end-to-end, verified continuously — not just at onboarding.
Real-Time Data Refresh
Dashboards stay in sync with your live billing and usage data, not a stale nightly export.
PostgreSQL Row-Level Security (RLS) Active
Row-level security policies enforce tenant boundaries at the database layer, not just the application layer.
Feature Grid
Dashboards Built for Your Role
Purpose-built dashboards that give every team the clarity they need to make smarter, faster decisions.
Engineering Overview
Last 30 daysTotal Spend
$156,430
+12.4% vs last month
Idle Resources
$24,830
+8.6% vs last month
Resource Efficiency
72%
+6.3% vs last month
Unit Cost
$0.045
-4.2% vs last month
Cloud Spend Over Time
Top Services
The Engineering Dashboard
Track spend by platform, catch idle resources before they pile up, and see infrastructure cost the way DevOps and SRE leads actually think about it - tied to what's running, not just what it costs.
Finance Overview
This MonthTotal Spend
$2,45,650
+3.8% vs last month
Budget Utilization
78%
+6.1% vs last month
Forecast
$2,92,430
+7.2% vs last month
Savings Identified
$18,650
+15.2% vs last month
Spend by Team
Budget vs Actual
78%
The Finance & Procurement Dashboard
Instantly see team-wise budget allocations, monthly trends, and amortization curves across all software licenses and multi-cloud environments.
Metric Builder (Preview)
Select Data Sources
Name
Formula
Preview
$0.023
Custom Metric Formulation (Coming Soon)
Build your own dashboards using the numbers you already have - blend cloud compute costs with AI token pricing to create the exact metric your team tracks, not just the ones we thought of first.
Your value journey
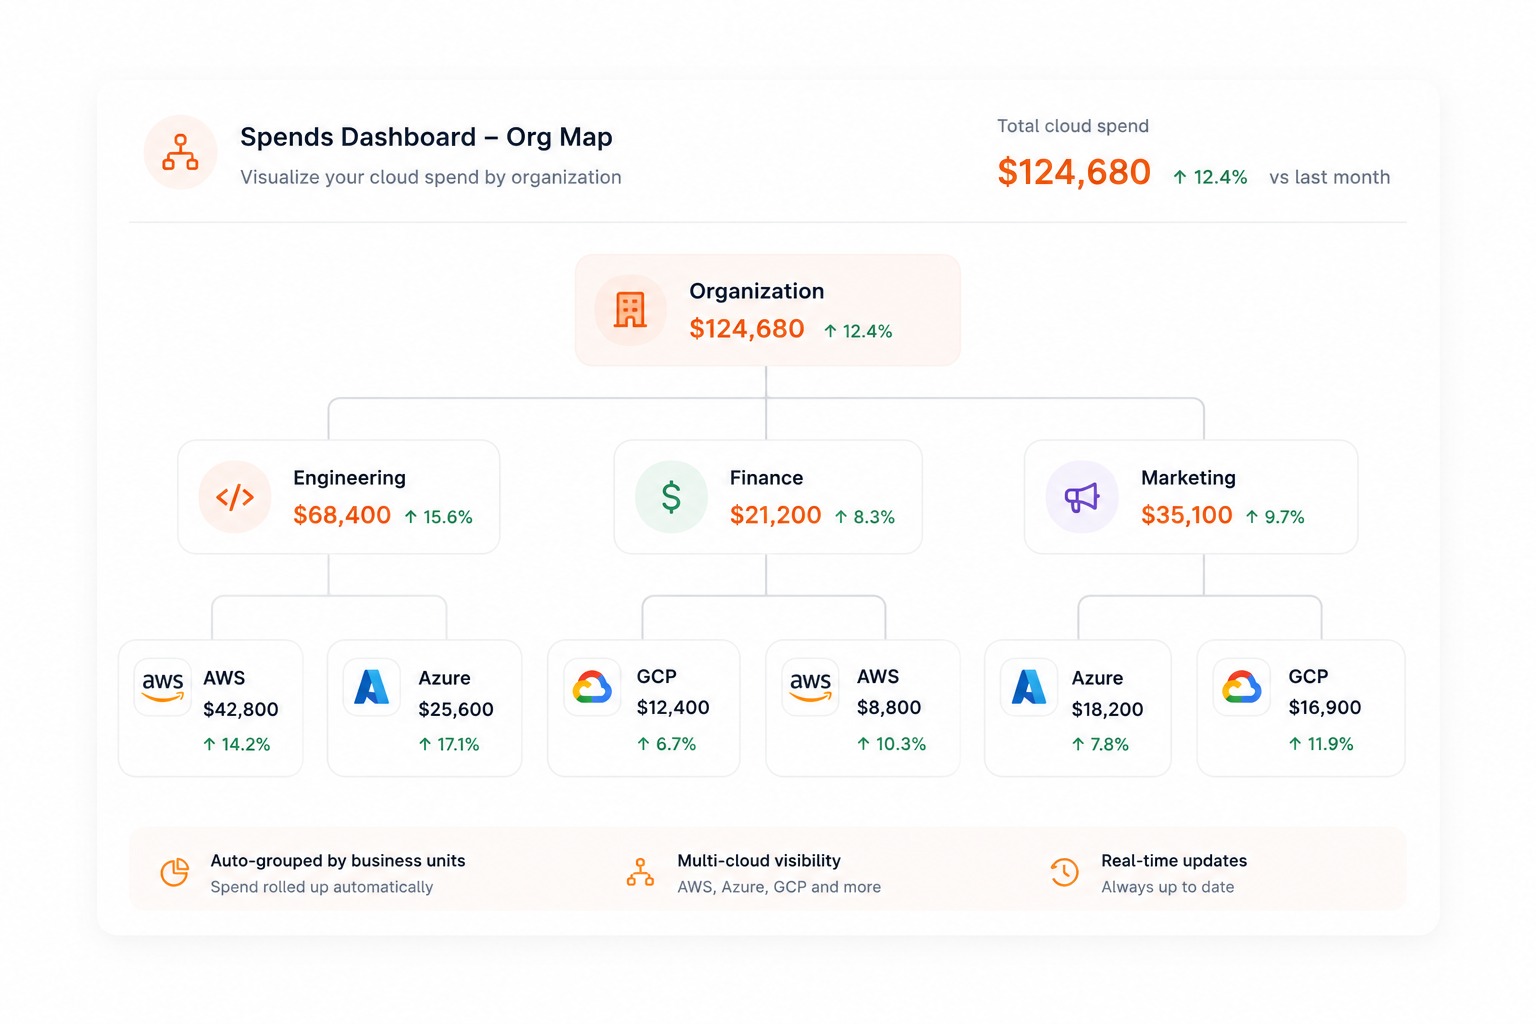
Instantly Map Your Org
Connect your stack to automatically surface pre-built dashboards optimized for Engineering, Finance, and leadership.
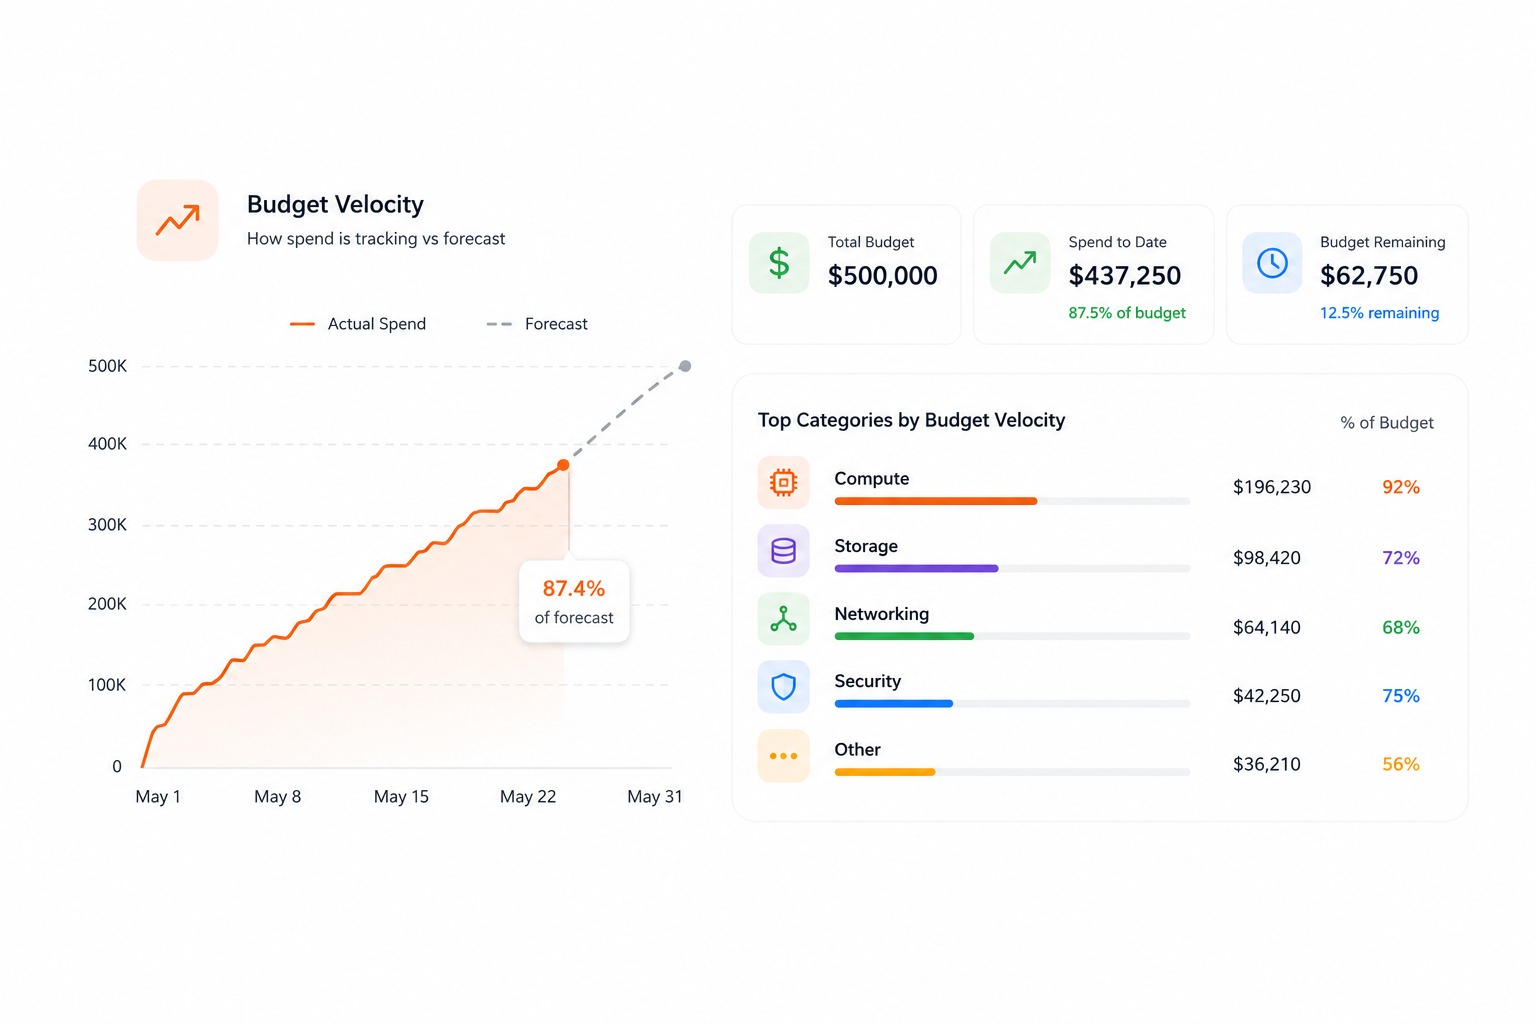
Track Budget Velocity
Spot pacing exceptions immediately via real-time category breakdowns and monthly historical spend trend overlays.
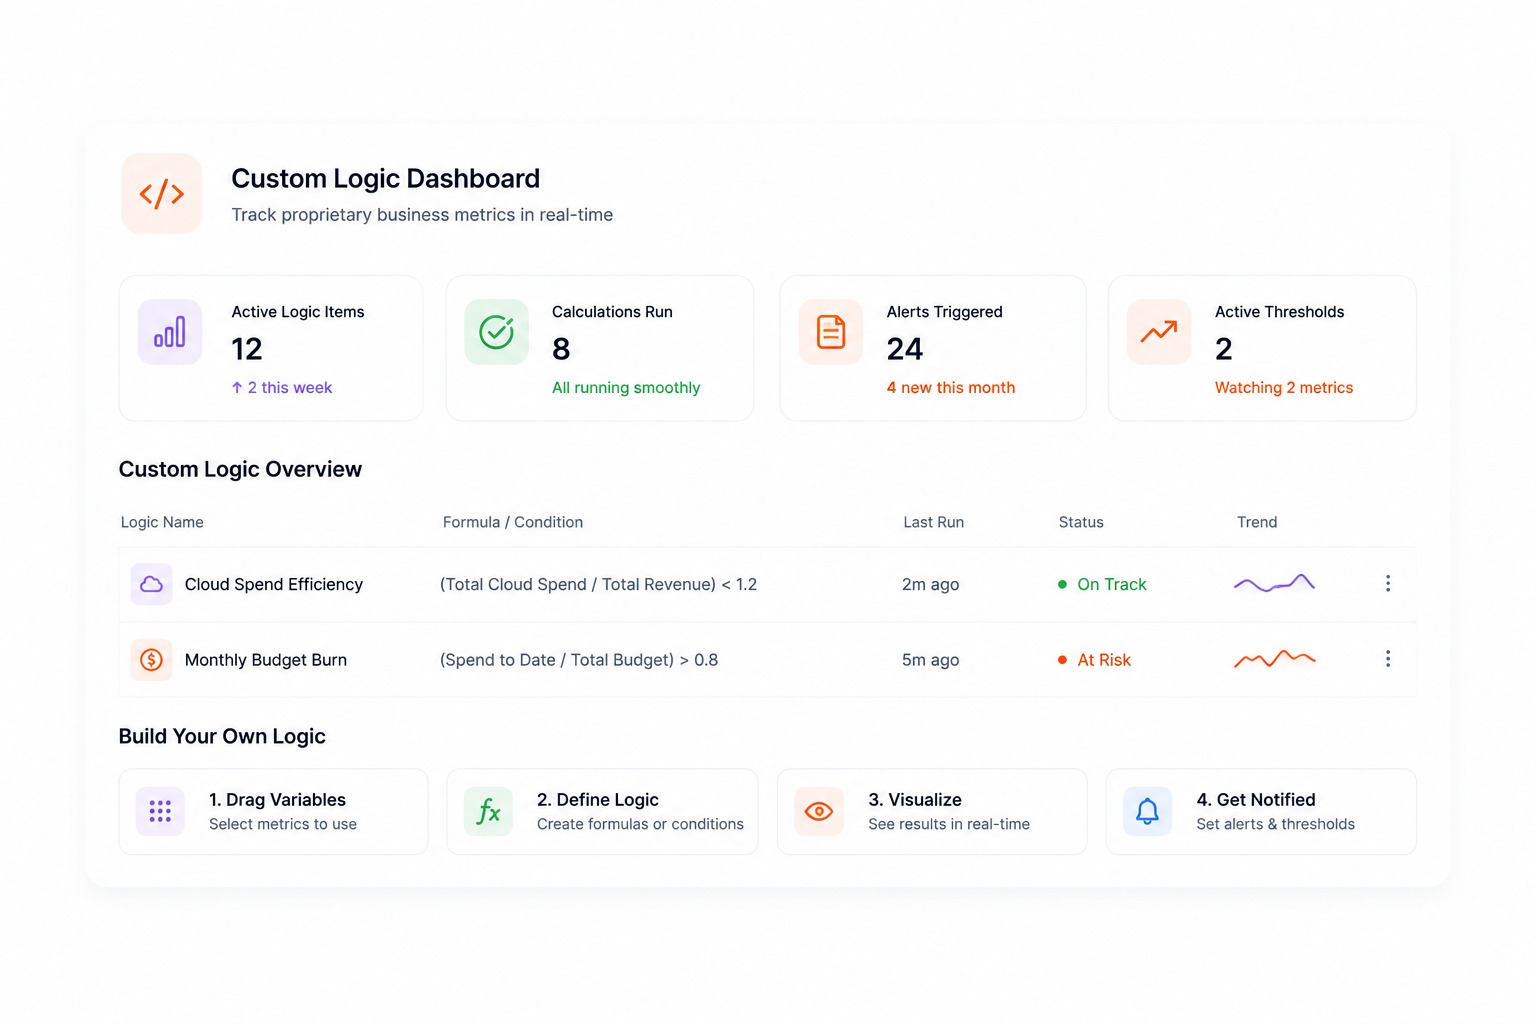
Flex to Your Logic (Coming Soon)
Build your own tracking logic - drag, drop, and define the formulas that matter to your business, all in one view.
Built for every stakeholder
- Simplify the monthly close.
- Slice tech spend by team or cost center using verified billing data instead of planning trackers or guesswork.
Move From Data Gaps to Complete Clarity.
One platform for every persona — engineering, finance, and leadership, all on the same numbers.