From raw spend data
to decisions you can defend
Dashboards, forecasts, budgets, and unit economics built on the data you've already connected, so every number tells you what to do next.
Analysis Studio
- Compute$1.62M (38%)
- Storage$1.03M (24%)
- AI / Tokens$0.90M (21%)
- Other$0.73M (17%)
INTEGRATIONS
Every source of spend, one connection away


Every angle of spend, fully analyzed.
See past the invoice - understand what's driving cost, risk, and waste across your entire stack.
Time Series Model
Surface anomalies and seasonality in spend by tracking every metric over time, not in isolation.
Vendor Status
See contract status, health, and renewal dates for every vendor in one dashboard.
Persona Views
Dashboards built for how each team actually works - not repurposed finance reports.
Unit Economics
Tie cloud and tech spend to business outcomes - cost per feature, service, or workload.
Budget
Set and track budgets by team, tool, or vendor with real-time actuals.
Forecast
Project future spend using real usage patterns, not flat projections.
Your value journey
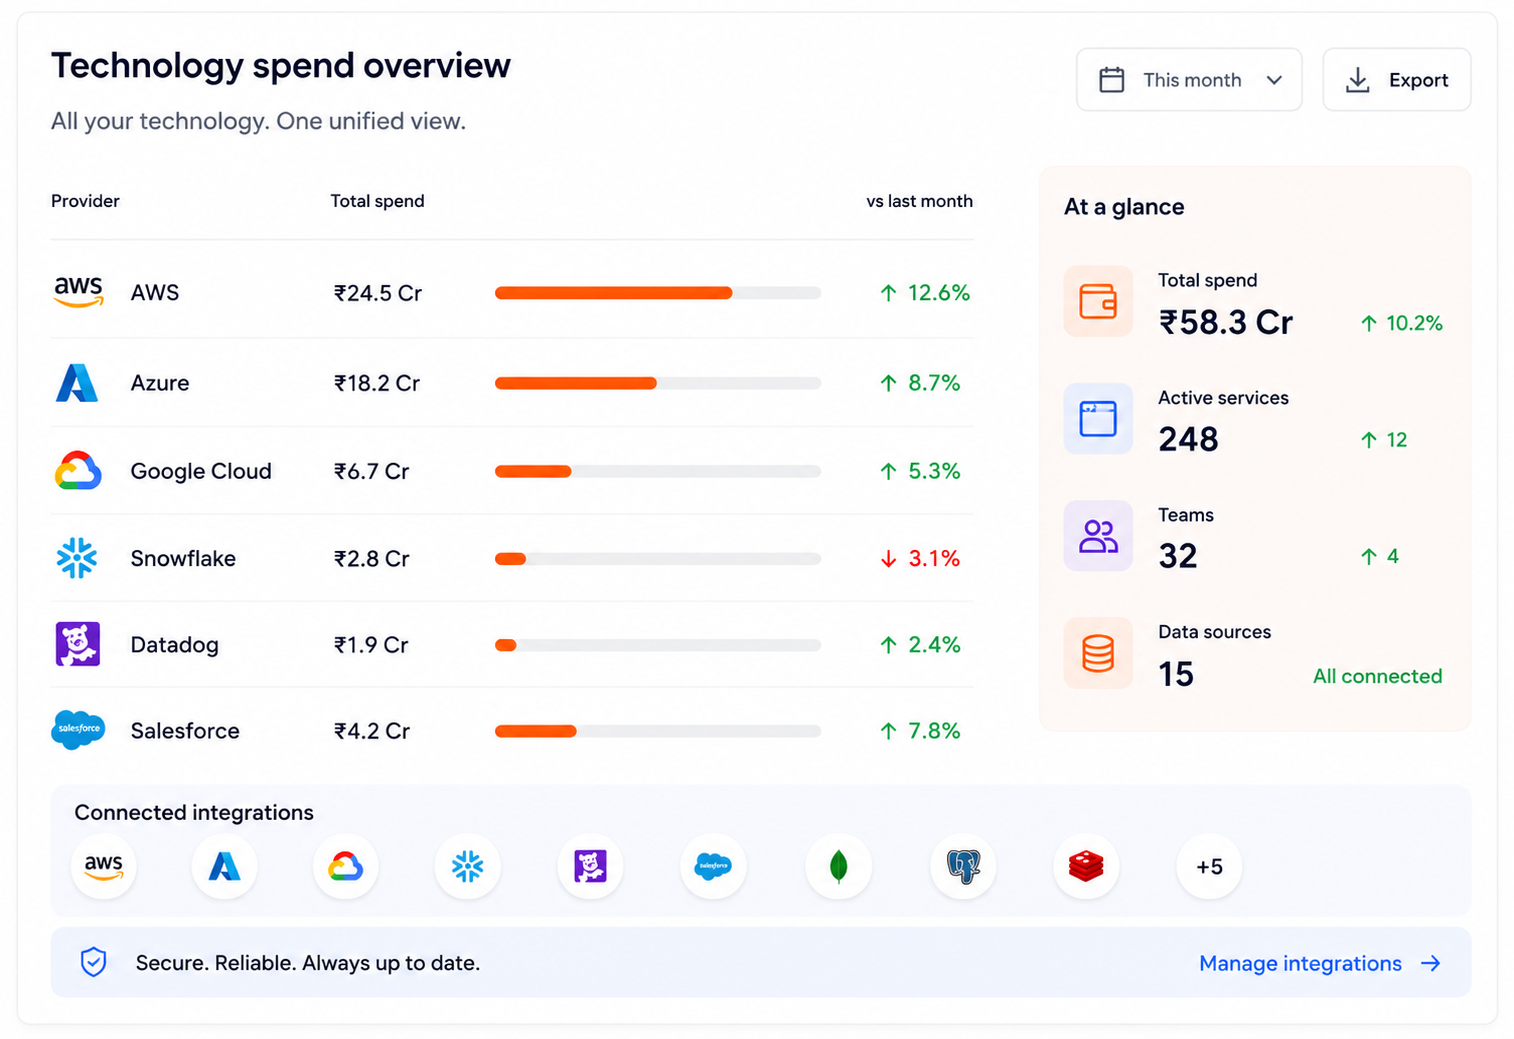
SEE
Every dashboard and persona view built on the same underlying data - so no two teams are arguing over whose numbers are right.
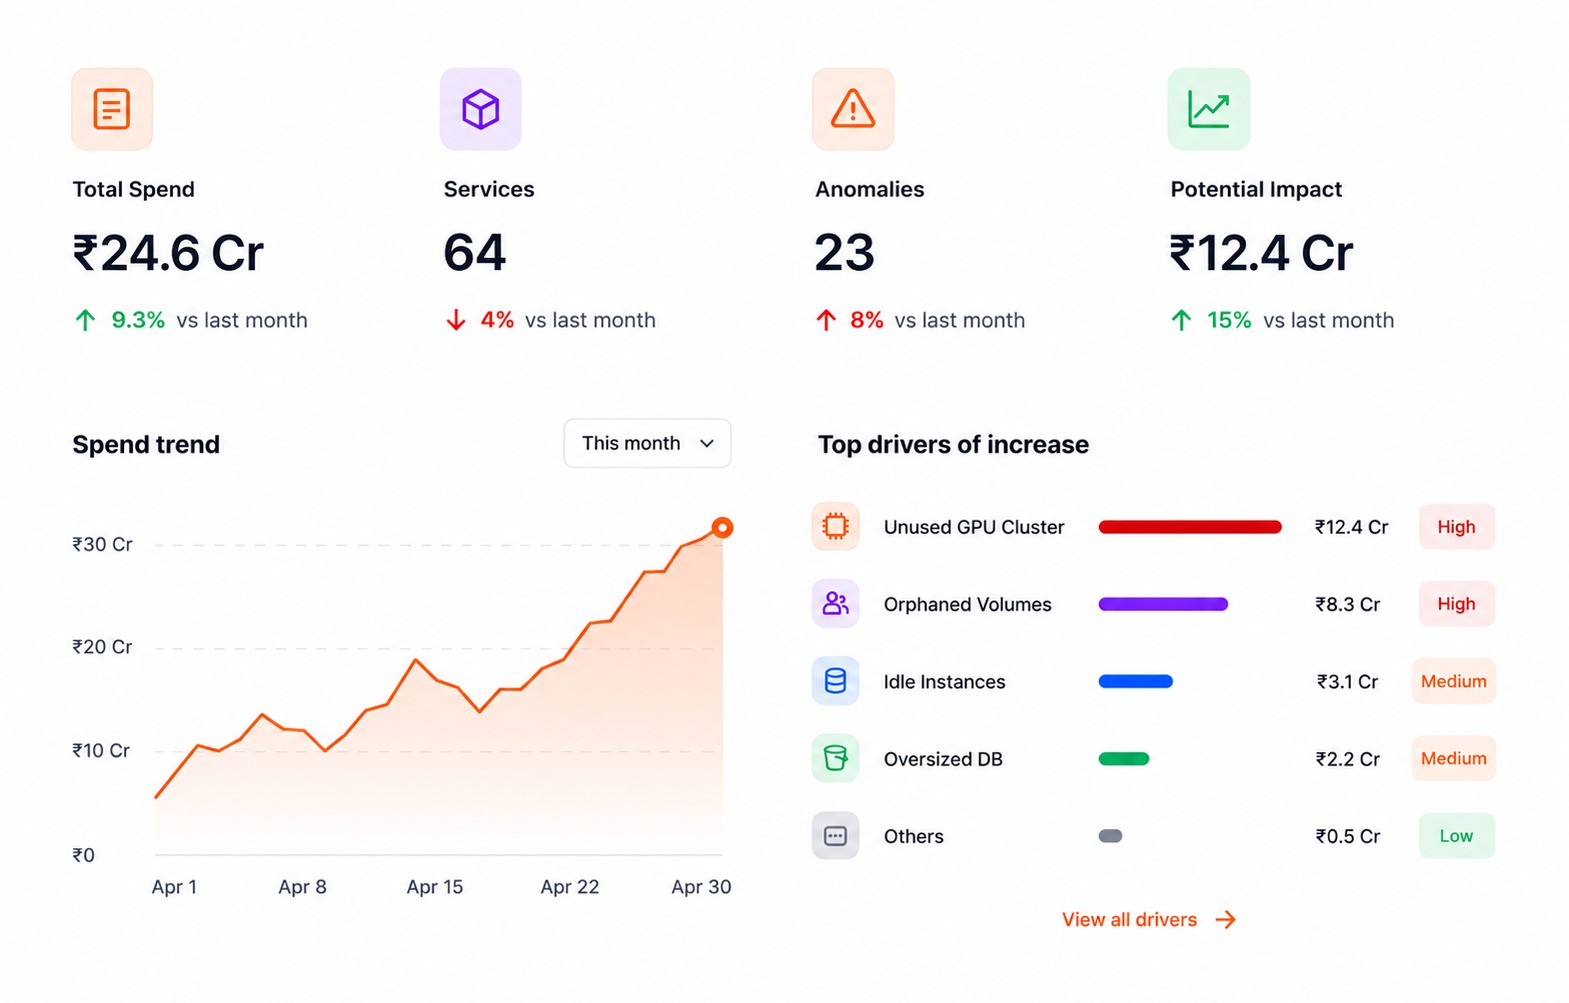
UNDERSTAND
Unit economics and time series models turn raw spend into "why it's happening" - not just "what happened".
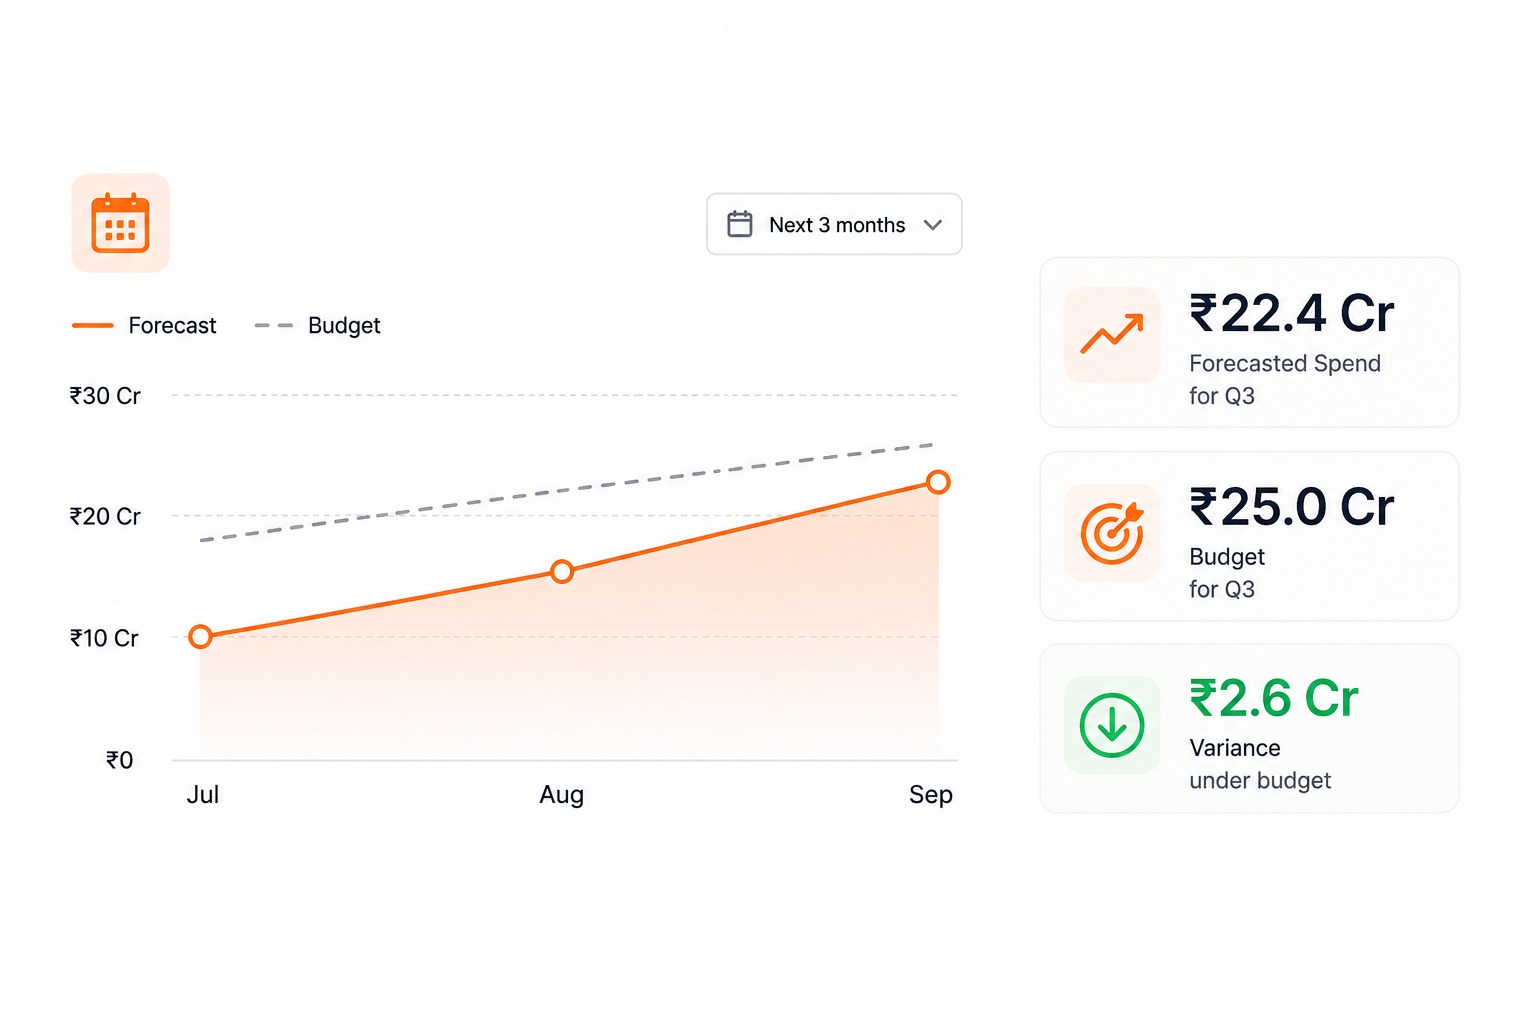
PLAN
Forecasts and budgets set expectations before the money moves, based on real usage, not guesswork.
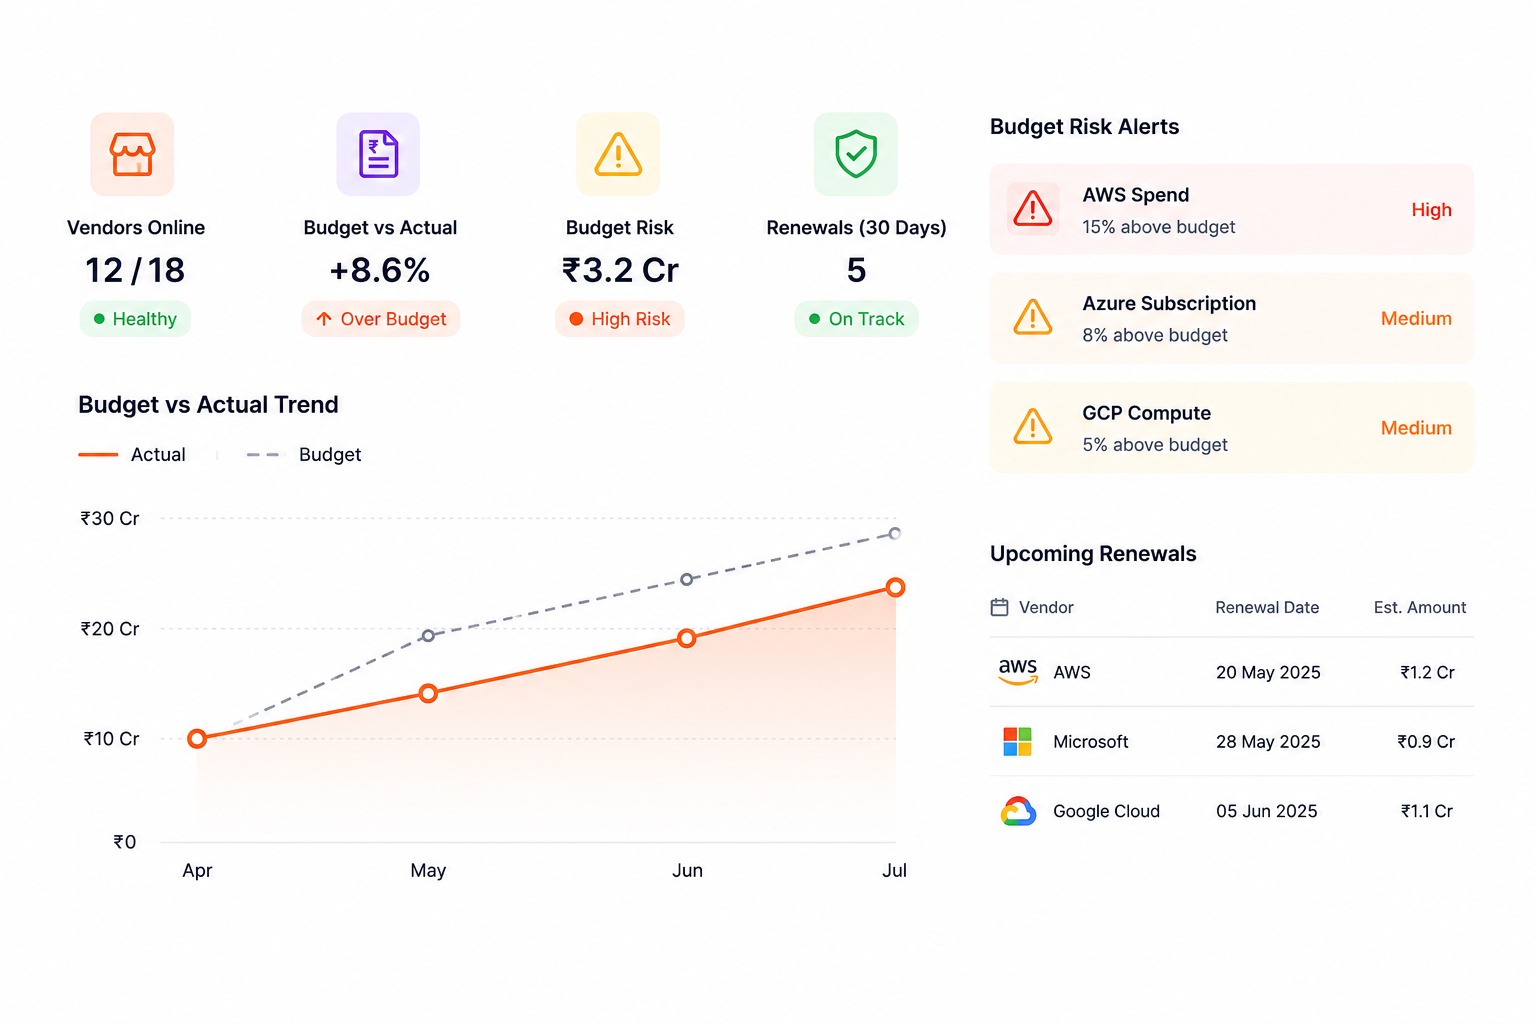
CONTROL
Vendor status and budget-vs-actual tracking flag risk early, so renewals and overruns never catch you off guard.
Built for every stakeholder
- Track every vendor before it becomes a problem
- See contract status and renewal dates for every vendor in one dashboard
- Compare vendor spend against usage to spot underused tools early
- Forecast upcoming renewals before they hit budget
Frequently Asked Questions
Everything you need to know about Digitomics and how we help organizations optimize their technology ROI.
Data that tells you what to do next
Stop reporting on spend after the fact. See it, understand it, plan around it.