Every signal, every service, one health view.
Bring metrics, logs, traces, and uptime checks from every cloud, cluster, and datacenter into a single monitoring workspace — with cost, capacity, and reliability side by side.
Total Monthly Spend
₹ 2.48M
↓ 18% vs last month
Feb 15 - Mar 27
Anomaly
+32%
Detected
Waste
₹ 2.4M
Potential savings
Vendor
3
Renewals
INTEGRATIONS
Every observability tool, one monitoring pipeline


Everything you need to monitor modern infrastructure.
From metric ingestion to SLOs, alerts, and HITL runbooks — the full monitoring workflow, built into one platform.
Unified metrics
Ingest CloudWatch, Azure Monitor, GCP Monitoring, and Prometheus into one time-series backbone.
Logs & traces
Correlate logs and distributed traces with metrics so a spike in latency links straight to the offending span.
Uptime & synthetics
Blackbox probes and synthetic checks verify user-facing endpoints from multiple regions, 24/7.
SLOs & error budgets
Define latency and availability SLOs per service and burn error budgets against real production traffic.
Alerts & on-call
Route alerts to the right team with severity, ownership, and runbooks — no more paging the wrong on-call.
Anomaly detection
Smart baselines per service and host flag latency, error, and saturation anomalies before customers notice.
Projected
$3.67M
Next 3 months
Kubernetes health
Node, workload, and namespace-level views for CPU, memory, restarts, and cost per workload.
Unified metrics
Ingest CloudWatch, Azure Monitor, GCP Monitoring, and Prometheus into one time-series backbone.
Logs & traces
Correlate logs and distributed traces with metrics so a spike in latency links straight to the offending span.
Uptime & synthetics
Blackbox probes and synthetic checks verify user-facing endpoints from multiple regions, 24/7.
SLOs & error budgets
Define latency and availability SLOs per service and burn error budgets against real production traffic.
Alerts & on-call
Route alerts to the right team with severity, ownership, and runbooks — no more paging the wrong on-call.
Anomaly detection
Smart baselines per service and host flag latency, error, and saturation anomalies before customers notice.
Projected
$3.67M
Next 3 months
Kubernetes health
Node, workload, and namespace-level views for CPU, memory, restarts, and cost per workload.
Unified metrics
Ingest CloudWatch, Azure Monitor, GCP Monitoring, and Prometheus into one time-series backbone.
Logs & traces
Correlate logs and distributed traces with metrics so a spike in latency links straight to the offending span.
Uptime & synthetics
Blackbox probes and synthetic checks verify user-facing endpoints from multiple regions, 24/7.
SLOs & error budgets
Define latency and availability SLOs per service and burn error budgets against real production traffic.
Alerts & on-call
Route alerts to the right team with severity, ownership, and runbooks — no more paging the wrong on-call.
Anomaly detection
Smart baselines per service and host flag latency, error, and saturation anomalies before customers notice.
Projected
$3.67M
Next 3 months
Kubernetes health
Node, workload, and namespace-level views for CPU, memory, restarts, and cost per workload.
Your value journey
COLLECT
Metrics, logs, traces, and uptime checks stream in from every cloud, cluster, and datacenter into one pipeline.
CORRELATE
One service model links metrics, traces, deployments, and cost — so any alert points at a real workload, owner, and blast radius.
ALERT
SLO burn, anomaly detection, and threshold rules page the right team with severity, runbook, and recent changes attached.
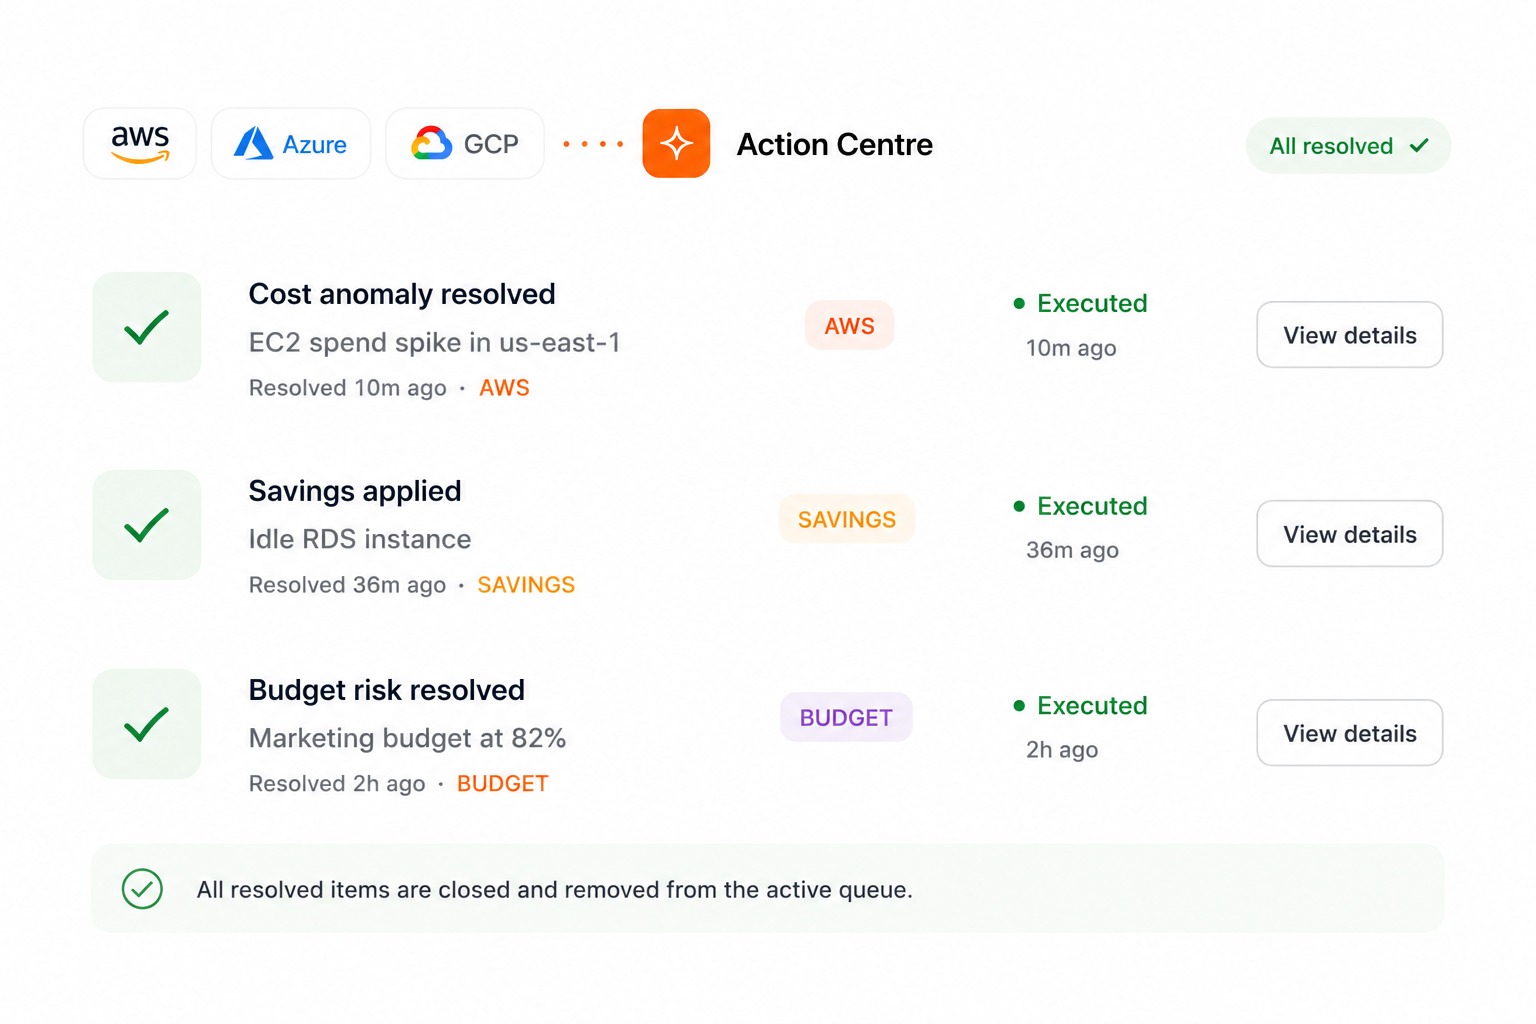
RESOLVE
HITL runbooks turn a triaged incident into an approved action — rollback, scale, or patch — with a full audit trail.
Built for every stakeholder
- One monitoring workspace across clouds, clusters, and legacy datacenters
- SLOs and error budgets tracked per service with burn alerts
- Alert routing by ownership, severity, and environment — no noisy paging
- HITL runbooks for scale, rollback, and remediation with full audit history
Frequently Asked Questions
Everything you need to know about Digitomics and how we help organizations optimize their technology ROI.
Bring every health signal into one workspace.
Connect your clouds, clusters, and observability tools, define SLOs, and start resolving incidents with cost context in minutes.